What’s the one mindset that separates a flash-in-the-pan branding victory from a self-sustaining user engagement juggernaut? Data-driven decision-making.
Every move you make as an app marketer needs to be backed by accurate metrics that give you a clear picture of what's working and what's not. With the right data, you can fine-tune your mobile engagement strategies, connect with your audience more effectively, and ultimately scale your app with minimal friction. To make things a little easier, we’ve identified the seven app marketing metrics that have the highest impact on your ability to grow.
Why These Metrics Matter in 2024
The app marketing landscape is more competitive now than ever. Users are bombarded with options, and their expectations for even a basic, “out-of-the-box” experience are much higher. Understanding these key metrics isn't just about knowing your numbers—it's about using those numbers to inform your engagement strategy and nurture lasting relationships with your users.
Remember, the goal is to thrive, not just survive.
For a deeper dive into tracking mobile engagement metrics, check out our guide to understanding mobile app user behavior.
7 Metrics Every App Marketer Should Track
1. Customer Lifetime Value (CLTV)
Customer lifetime value (CLTV) is a critical metric that estimates the total revenue you can expect from a user throughout their relationship with your app. It’s essential to understand how much you can afford to spend on acquiring new users and how to allocate your marketing budget effectively.
Knowing your CLTV helps you determine the return on investment (ROI) of your marketing efforts. It also guides your decisions on user acquisition costs and retention strategies.
Say you’re a marketer for a mobile fitness app and you’ve noticed that your CLTV is lower than you’d like. After digging into the data, you realize that while many users download the app and use it for a few weeks, a significant portion never convert to the premium subscription or tend to churn within a few months.
To address this, you segment users based on behavior:
- High-engagement users receive personalized messages promoting premium features
- Low-engagement users get re-engagement offers like discounts or free trials
- Churning users are targeted with win-back campaigns featuring personalized challenges
The tailored engagement strategies not only boost user retention but also optimize the marketing budget by focusing efforts on users with the highest potential value. This approach leads to a higher ROI, as you spend less on acquiring new users and more on maximizing the value of existing ones, ultimately leading to more sustainable growth for the app.
Curious about the quality of your users? Our guide to calculating mobile user lifetime value goes into more detail!
To summarize, CLTV is calculated by multiplying the average purchase value by the average purchase frequency rate, then multiplying the result by the average customer lifespan, and finally subtracting the customer acquisition cost (CAC).
2. Cost Per Acquisition (CPA)
Cost per acquisition (CPA) measures how much you’re spending to acquire a new user. This metric is fundamental for determining the efficiency of your marketing campaigns. Keeping your CPA low while maintaining high-quality user acquisition is crucial for sustainable growth. A high CPA could mean you’re spending too much to gain users who don’t provide enough value in return.
What about cost per install (CPI)? Where CPI only measures the cost to get a user to install the app, CPA measures the cost to acquire a user who completes a specific action (such as signing up or making a purchase) and provides a more comprehensive view of acquisition costs as it focuses on users who take meaningful actions beyond just installation
Monitor your CPA across different channels to identify which ones are delivering the best value for money. Consider reallocating your budget towards higher-performing channels.
To reduce your CPA, consider:
- Optimizing ad targeting using advanced targeting options, such as lookalike audiences or interest-based targeting.
- A/B testing different ad creatives, messaging, and formats to identify which ones drive the highest conversions at the lowest cost.
- Leveraging retargeting campaigns to re-engage users who have shown interest in your app but haven’t yet converted.
- Focusing on high-performing channels and allocating more budget to those with the best performance in terms of conversion rates and lower CPA.
- Improving user onboarding to reduce drop-off rates and ensure new users are more likely to complete desired actions.
3. Retention Rate
Your retention rate is the percentage of users who continue to use your app over a specific period. This metric is vital for understanding how well your app is meeting user needs. High retention rates indicate that users find value in your app, while low rates suggest there may be issues with user experience, engagement, or overall app value.
If your retention rate is dropping, analyze the user journey to identify pain points where users may be disengaging. Consider implementing personalized onboarding or re-engagement campaigns to keep users active.
When was the last time you gave your onboarding experience a facelift? This Mobile Onboarding Toolkit has the resources you need, all in one place (and it’s free!)
These are the five keys to success to keep top of mind when striving for a strong retention rate for your app:
- Seamless User Experience: Ensure your app is intuitive and easy to navigate, minimizing friction points that could lead to user frustration and drop-off.
- Personalized Onboarding: Offer a tailored onboarding experience that addresses individual user needs and showcases the app’s core value quickly.
- Regular Feature Updates: Keep users engaged by consistently rolling out new features, improvements, and content that meet their evolving needs and preferences.
- Effective Push Notifications: Use personalized push notifications to remind users of your app's value and encourage regular engagement without being intrusive.
- Strong Customer Support: Provide accessible and responsive customer support to quickly resolve user issues, enhancing their overall satisfaction and loyalty.
4. Average Session Length
Average session length refers to the average amount of time a user spends on your app during a single session. It provides insights into user engagement and your app's ability to hold attention. Longer session lengths often indicate higher user engagement, which is key to driving in-app purchases and ad revenue.
Consider this example:
An app marketer for a mobile e-learning platform notices that the average session length is shorter than expected, indicating that users may not be fully engaged with the content. To address this, the marketer decides to analyze user behavior and discovers that users often abandon sessions due to lengthy video tutorials.
Based on this insight, the marketer initiates a strategy to break down long tutorials into shorter, more digestible segments and sends personalized push notifications to users, encouraging them to complete the next module.
As a result, the average session length increases, leading to higher user engagement and improved course completion rates.
5. Click-Through Rate (CTR) for Push Notifications
Click-through rate (CTR) for push notifications measures the percentage of users who tap on a push notification after receiving it. This metric is specific to mobile messaging and is crucial for evaluating the effectiveness of your push campaigns. A high CTR indicates that your push notifications are relevant and engaging to your users, while a low CTR suggests that your messaging strategy may need adjustment.
Relevance through personalization is the key driver in improving mobile app CTR – How many of the following tactics are you currently using in your engagement strategy?
- Leverage User Behavior Data: Send notifications based on individual user actions, such as reminding them to complete an abandoned task or revisit recently viewed content.
- Incorporate User Preferences: Tailor notifications to align with the user's stated interests or preferred topics, making each message more relevant.
- Use Geotargeting: Trigger notifications based on a user’s location, offering relevant content or promotions when they are near a specific place or event.
- Personalized Timing: Schedule notifications at optimal times based on when each user is most likely to engage with your app, rather than sending at a generic time.
- Include Personal Details: To create a more direct and engaging message, include the user’s name or other personal details in the notification.
Test different messaging strategies, such as personalization or segmentation, to improve your CTR. Pay attention to timing and relevance to ensure your notifications are both timely and valuable.
6. In-App Messaging Conversion Rate
Your in-app messaging conversion rate tracks the percentage of users who complete a desired action after receiving an in-app message. This could be anything from making a purchase to updating their app. This metric directly ties your in-app messaging efforts to tangible outcomes, showing you how effectively your messages are driving user behavior.
If your conversion rates are low, experiment with different types of messages, calls-to-action, or targeting strategies to see what resonates best with your audience.
Sometimes the simplest changes are the most effective. If you are A/B testing different CTAs for your mobile shopping app, you may experiment with copy like "Shop Now," "Discover Deals," and "Claim Your Discount." After discovering that "Claim Your Discount" consistently drives the highest conversions, you learn to start leveraging more incentive-based CTAs across your messaging strategy, ultimately boosting in-app conversions as users respond better to messages that emphasize immediate value.
Learn how to write better CTAs to give your in-app messages (and conversion rates) a shot of new life!
7. Opt-In Rate for Push Notifications
Opt-in rates for push notifications measure the percentage of users who agree to receive push notifications from your app. This metric is crucial because it determines the reach of your push campaigns.
A high opt-in rate means you have a broader audience for your push notifications, which can drive higher engagement and retention.
Apps with low opt-in rates for push notifications often struggle because users don't perceive immediate value or relevance in the notifications they might receive. This can be due to poorly timed opt-in prompts, where users are asked to enable notifications before they've had a chance to experience the app's benefits.
Additionally, if your app's initial user experience is confusing or underwhelming, users may hesitate to opt in, fearing that notifications will be more annoying than useful. Privacy concerns also play a role; if users aren't confident that their data will be handled responsibly, they're less likely to allow notifications.
Finally, if your app doesn't clearly communicate the benefits of opting in—such as personalized updates, exclusive offers, or timely reminders—users may simply choose to skip the opt-in process altogether.
If your opt-in rate is low, consider revisiting your opt-in prompt strategy. Clear communication about the value users will receive from opting in can significantly improve this rate.
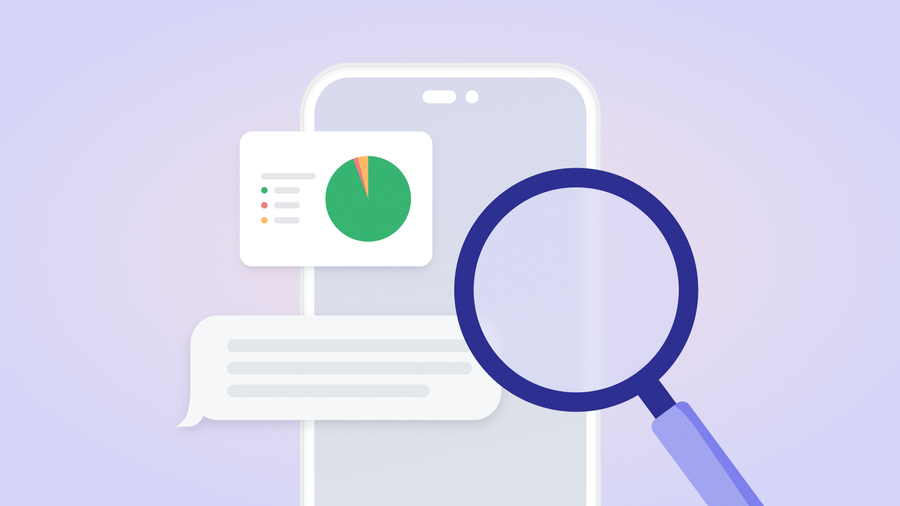
Choosing the Right Messaging Provider
Tracking these metrics is essential for any app marketer looking to stay competitive. However, understanding these metrics is only half the battle—you also need the right tools to act on the insights they provide. Choosing a messaging provider that gives you clear visibility into these metrics is crucial.
OneSignal offers app marketers an accessible engagement solution, with deep personalization, a brilliant cross-channel campaign builder, and a robust analytics suite that allows you to optimize your strategy and drive success.
Get Started for Free