In a competitive market, we know that it is crucial for our users to work efficiently. As a product-led company, this is also one of our core values: build a product that anyone can use to engage their customers. That’s why we're proud to earn yet another Easiest to Use award from G2.
But our work isn’t over; we continue to strive to make the platform even easier to use. This quarter, we’ve rolled out new tools that help you move faster. From targeting improvements to synced email rows and data exports, these new features ensure you can target, send, and understand your audience with less work.
Here’s a closer look at a few things we released this past quarter:
Reach anonymous users with Journeys
We’ve made it easier to connect with a wider audience by improving how Journeys work behind the scenes. Now, new Journeys automatically include qualified anonymous users. This is especially valuable for driving growth with potential users who haven’t yet converted. For example, you can send personalized push notifications to new app installs that haven’t completed their account to drive new user retention.
Gain precision and save time with scheduled Journeys
If you've been struggling with manually starting or stopping your Journeys at odd hours, we have good news for you.
With Journeys scheduling, you can predefine start and end times, simplifying the execution of your cross-channel campaigns.
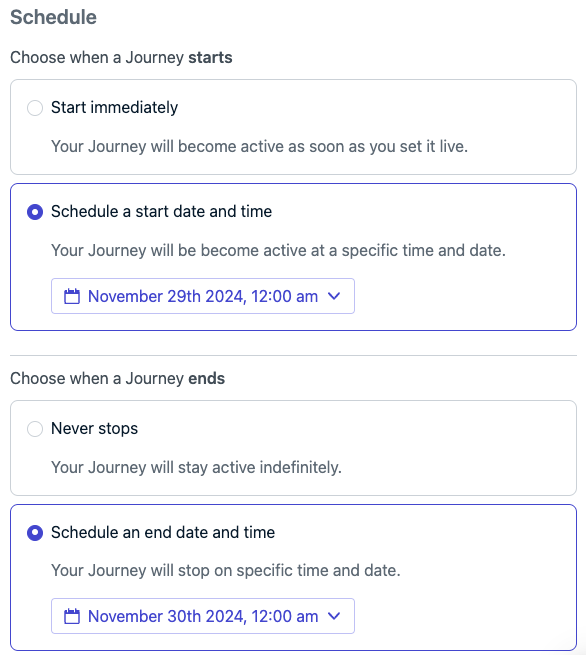
Scheduling your Journeys in advance ensures they launch and end exactly when planned, freeing you from constant monitoring and manual effort. This feature lets you focus on fine-tuning your messaging and overall strategy, confident that your campaigns will run smoothly at the perfect time.
Email made easier with saved rows
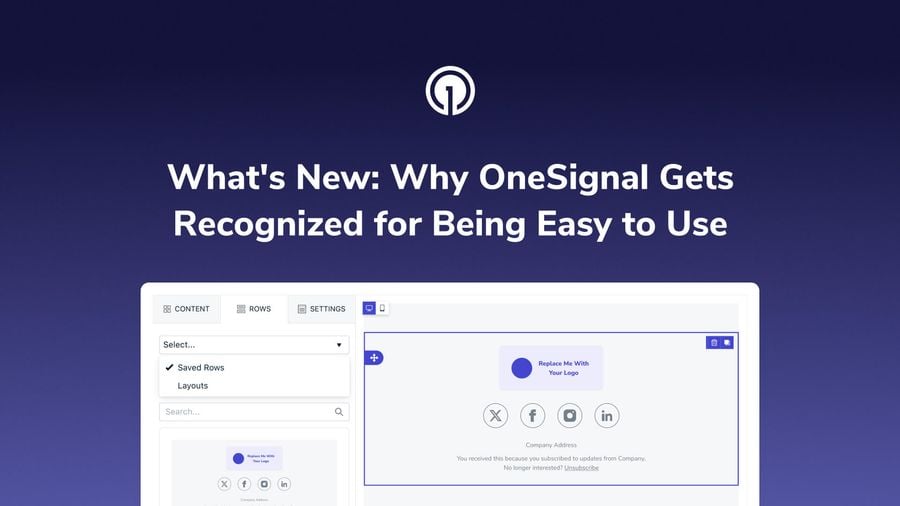
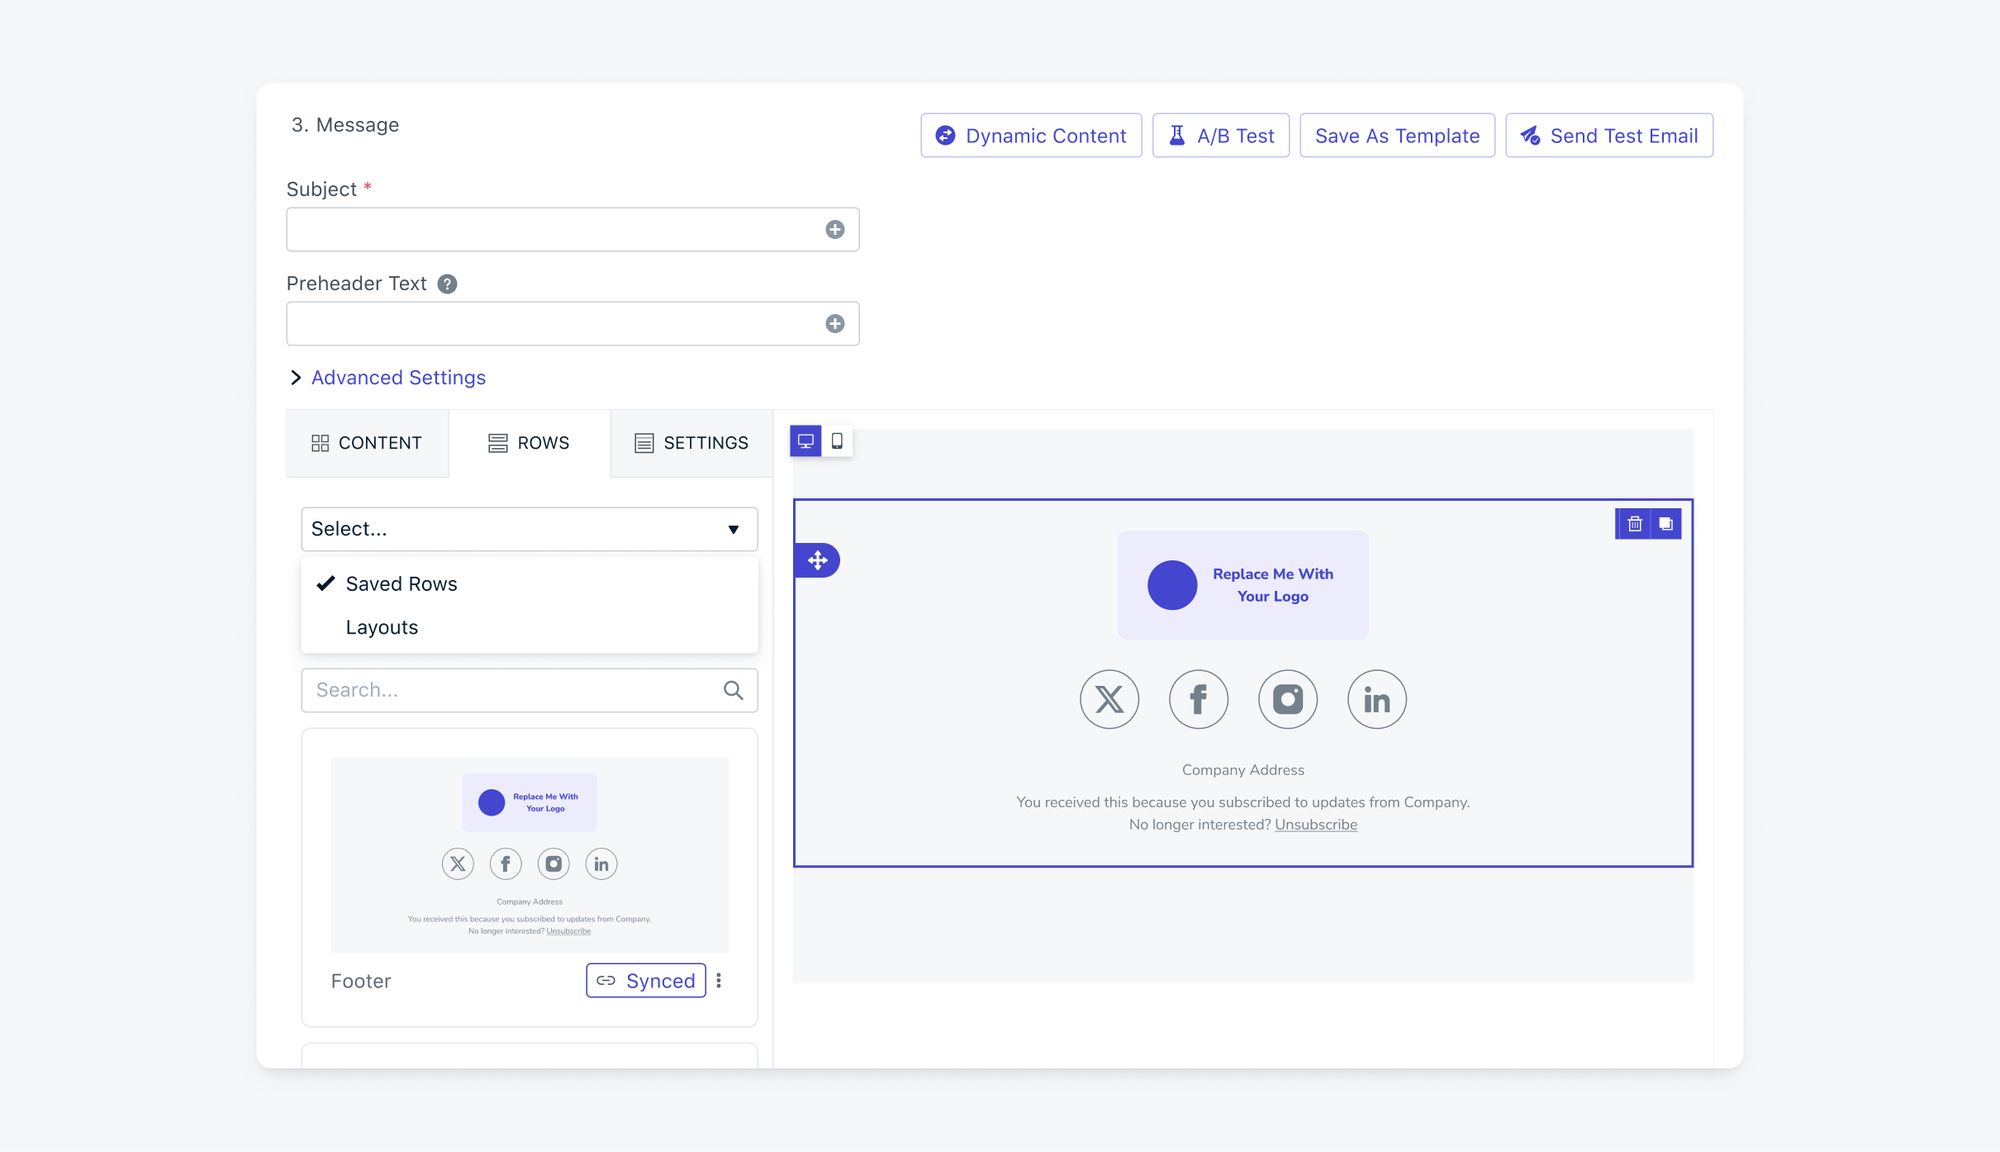
Create reusable content blocks for your templates to streamline email creation and management. Need to update content across multiple campaigns? Simply update the saved row, and your updates will automatically sync across all campaigns using that saved row. Perfect for headers, footers, disclaimers, and other elements that you consistently use across multiple email campaigns. Save time with saved rows.
Understand your users with the user profile page
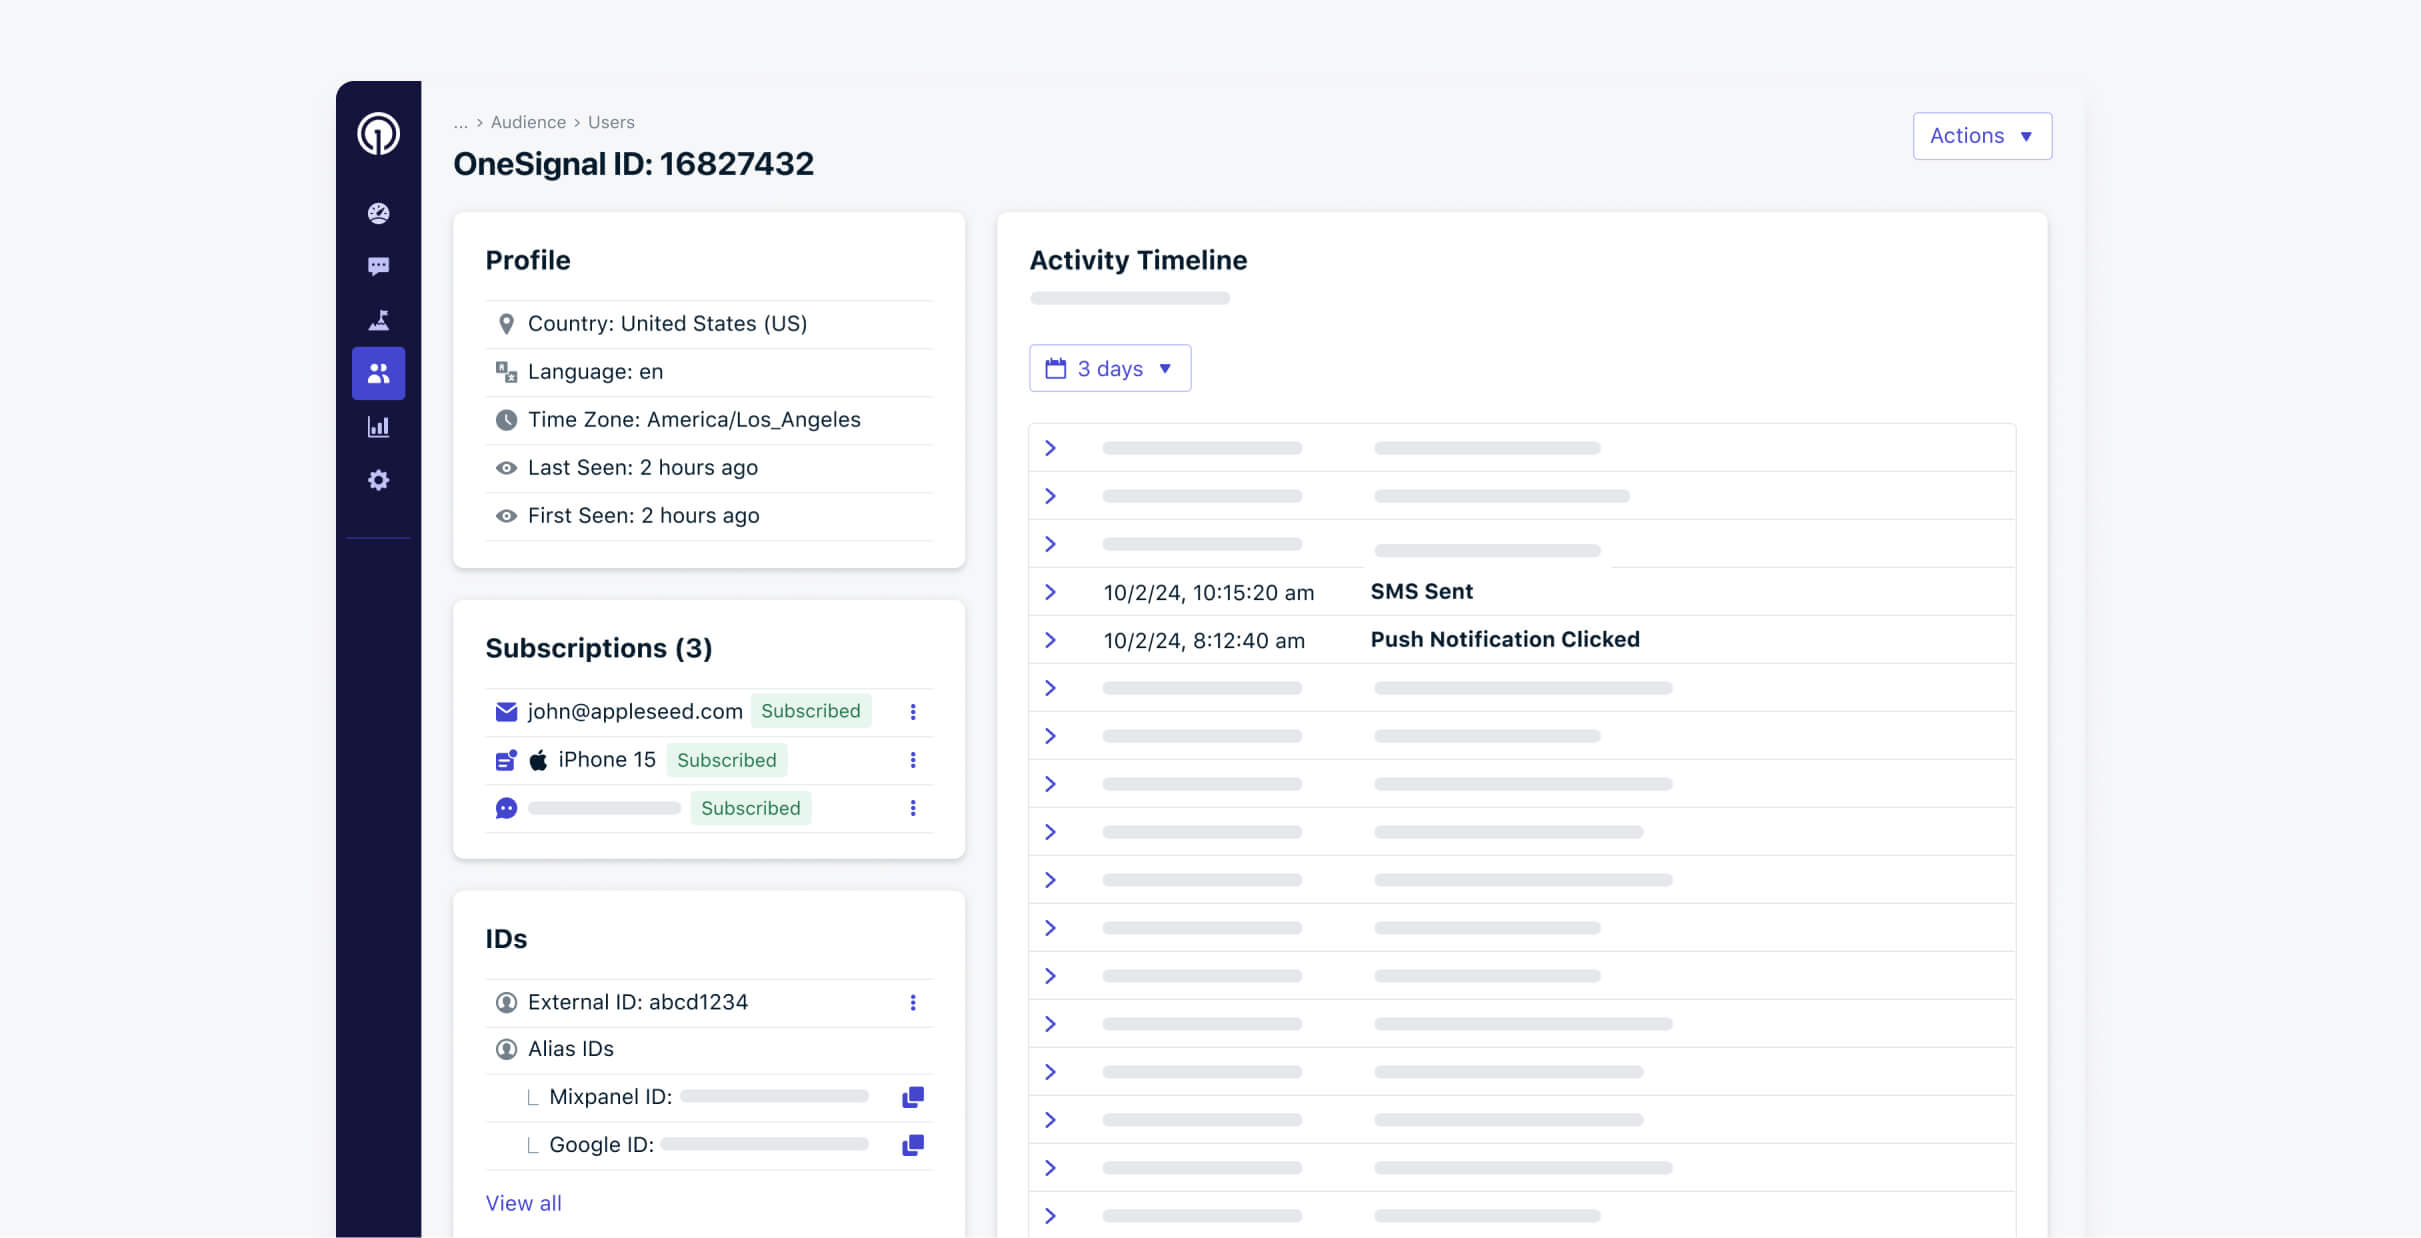
User profiles are now generally available to complement subscription profiles. Easily see user-level data at a glance, including associated subscriptions and their statuses. Edit or add data tags for segmentation and personalization. Apps on Professional or Enterprise Plans can see recent message activity history in the activity timeline. Get a more complete overview of your users in a digestible way.
Export your subscription trends data
Our users love how the OneSignal dashboard shows trends in subscriptions, with the ability to filter across different channels and platforms as well as compare data across time periods. Now, you can easily export that data as a CSV to share results with other teams or do more analysis in your analytics tools.
This quarter, we’ve added new tools to help you save time and manual work as you work to improve your messaging strategy. And to see even more features and improvements we released, visit our changelog.
If you’re ready to get started with OneSignal, please reach out to our sales team, who can provide a consultation on what makes sense for your business. You can also get started on your own for free by creating an account and consulting our quickstart setup guide.
Get Started for Free